|
| 
|
 Combustion 5 Combustion 5
As mentioned, we are referring to engines from the 1970s at the latest. Nowadays, the requirements for ignition timing are similar, except that the control is completely non-mechanical, i.e. electronic. Actually, two
characteristic curves emerge from what has been said so far. Both would show the ignition angle on the y-axis, e.g. up to 50° before TDC. In the case of dependence on engine speed, this would then be plotted on the x-
axis up to 6,000 rpm, for example.
It's more difficult with the load. One could follow the example of modern engines, which, for example, generate a load request (torque) in Nm from the signal of the foot controller. We simply take the unmodulated voltage
from the suction pipe pressure sensor. At atmospheric pressure, this is 4–5 volts and drops accordingly with negative pressure.
However, electronic control allows us to take a completely different procedure than before. A centrifugal force control system could only adjust the ignition further and further forward as the speed increased. Of course, an
attachment point was possible. But until then, it was only possible to achieve an ignition timing proportional to the engine speed.
That's much better now. We test the engine on the test bench and, for example, increase the speed by 100 rpm at a time to see exactly what ignition timing the engine needs. It's not that simple, because we have to decide
whether we want maximum performance, minimum fuel consumption or the best exhaust emissions, for example.
We then store these pairs of values in an electronic memory. Of course, that's not enough for us, because there's still the load. That complicates matters. For we now have an ambition that we could not take into account
before. We want to gradually reduce the load at each measuring point from 4 volts.
That won't work, says the test manager, because that would mean 54 measurement series from 600 rpm to 6000 rpm. If we assume the same number for the load, that makes just under 3,000 measurements. At 2
minutes per adjustment and measurement, that's 100 hours of testing. However, since not much changes in an engine even at 500 rpm, this gives us 12 * 12 = 144 measurements.
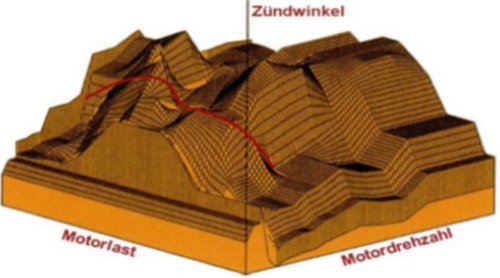
The resulting value matrix is called a 'characteristic map'. It differs from two characteristic curves because it checks all combinations. Such characteristic maps govern automotive technology today, from engine
management to ABS and beyond. And if your car enjoys tuning, then not much else is done there other than changing the engine characteristic map, whether it's good for the engine or not.
|
|