|
p-V-Diagram 2

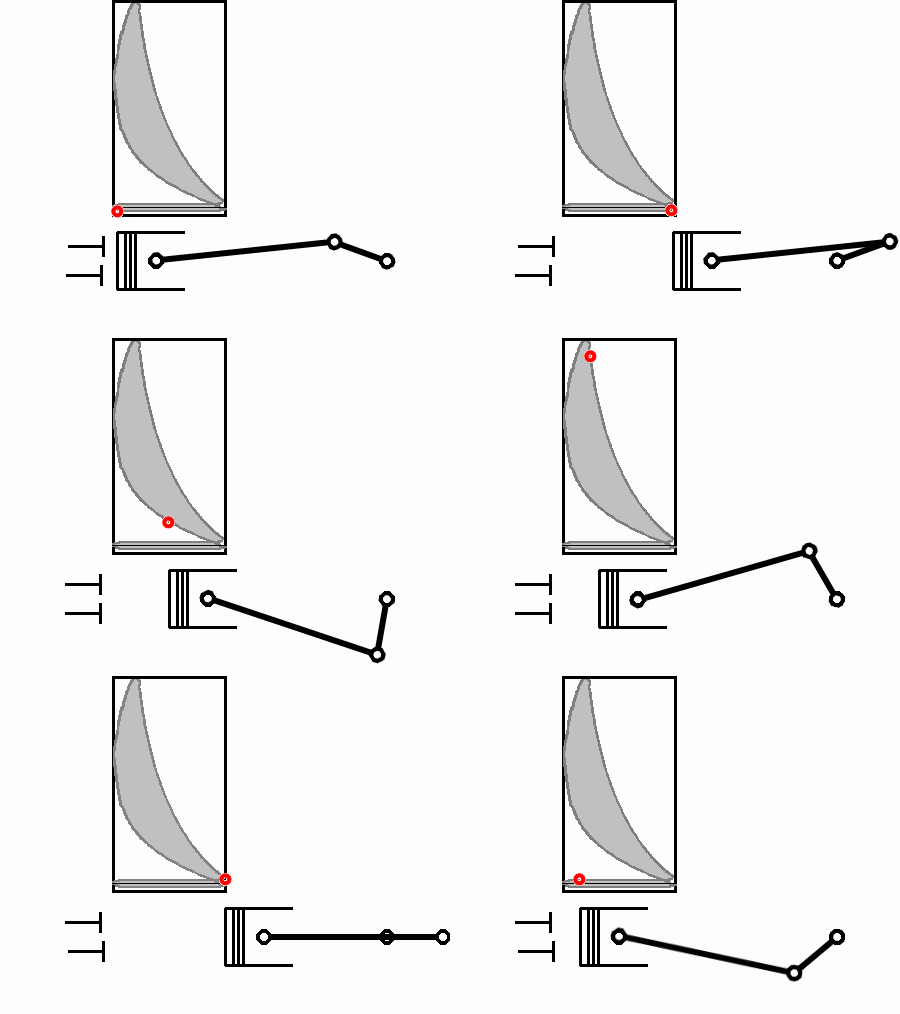
The diagram shows the course of the pressure through the cubic capacity in the individual strokes. The cubic capacity area is passed through four times, which results in four individual curves. In each case, two of
them belong together. The compression- (top left) and the working pressure kurve (top right) are called the high pressure loop, the exhaust- (upper of the two bottom curves) and the intake pressure kurve (lowest) are
called the charge changing loop.
The area between the respective curve and the one-bar line (athmospheric pressure) directly above the X-axis, shows the performance which must be gained through the working stroke and the energy which must be
put in during the compression stroke. The difference between the two is then, the actually achieved performance, shown by the grey area between the curves.
However, in the four-stroke process, one must also take the area of the charge changing into consideration. After all, the attainable performance is not reduced by only the compressing, but through the intaking and
exhausting as well. Should one read these curves (in reality far less smooth) out from an actual engine, one can then determine the real internal performance, and thus, also the efficiency
The above p-V-diagram thus, depicts a basically measurable curve, only, it doesn't always look as smooth as the one shown here. In these curves, faults in the respective engine are shown clearly, e.g., with ignition
retard, a shifting of the maximum to the right, and with it, a reduction of the usable performance. 05/10
|
|