
|
Fish hook curve diagram
If you don’t have too much experience with diagrams, then click on the above diagram twice to see the complete picture. Because nothing happens on the rest of the surface, it was simply omitted.
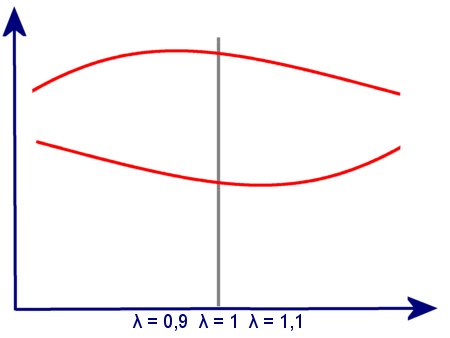
We'll start with another diagram, which you may recognise. It shows two curves, which are laid over different Lambda values. Thereby, the upper curve represents the performance or the torque and the lower, the
specific consumption. So, if, one makes the mixture in a petrol engine a little richer, a bit more than Lambda 1, one would achieve more performance. If the mixture is made too rich, the performance will drop again. Vice
versa, if the mixture is a little leaner, the consumption will be lower, if it's made too lean, it will rise again.
Of course, both curves apply to a homogenous mixture formation. If one manages to create a slightly richer ignition area in a layer charge, an even lower consumption is still possible, if the environment is substantially
leaner.
Now, we can apply this knowledge to the above diagram. An important piece of background knowledge: the position of the throttle-flap and the RPM are kept as constant as possible. Obviously, one has experimented
with varying air/fuel ratios and thereby, has measured the average effective pressure, i.e., the delivered torque and the specific consumption.
The result is about the same. The lowest consumption would correspond to a horizontal tangent from below and meeting the red curve approx. at Lambda = 1,1. The highest achievable torque would be a vertical
tangent, which shifted from the right, would meet the curve at about 0,9.
The point is, the curve, similar in shape to a fish hook, is more precise, because it documents, how the achievable torque, when further enriched, is slowly reduced and at 0,65, has the same effect as at 1,05. The left
branch of the curve is even more interesting, because in this case, not only does the consumption at 0,87 and at 1,25 remain roughly the same, but when made leaner, an additional consumption increase by 50 g/kWh
threatens.
Indeed, have a look at how the achievable torque drops by almost half. And why don't the ends of the curve go on further? Because then the igniting of the either much too rich or much too lean mixture, is no longer
possible. In the left branch of the curve, some misfiring is already indicated, this costs a lot of fuel and also reduces the performance. 06/14
|
|